
August's count is 4,645, down 680 in two years. Under-25s are the only band up over that stretch, at 970, and Bridlington South has the most at 90.
The number of people claiming unemployment-related benefits in the East Riding of Yorkshire has fallen by 680 in two years. Every age group shared in that fall except one.
August’s count is 4,645, which is 2.3% of everyone aged 16 to 64. Two Augusts ago it was 5,325. Over those two years claimants aged 25 to 49 fell by 510 and claimants aged 50 and over fell by 220. Claimants aged 16 to 24 went up by 45, from 925 to 970.
That is the whole story of this release. The district’s labour market has improved. It has not improved for the young.
Three Augusts, three age groups
| Age band | Aug 2024 | Aug 2025 | Aug 2026 | Two-year change |
|---|---|---|---|---|
| 16 to 24 | 925 | 880 | 970 | +45 (+4.9%) |
| 25 to 49 | 2,970 | 2,440 | 2,460 | -510 (-17.2%) |
| 50 and over | 1,430 | 1,150 | 1,210 | -220 (-15.4%) |
| All ages | 5,325 | 4,470 | 4,645 | -680 (-12.8%) |
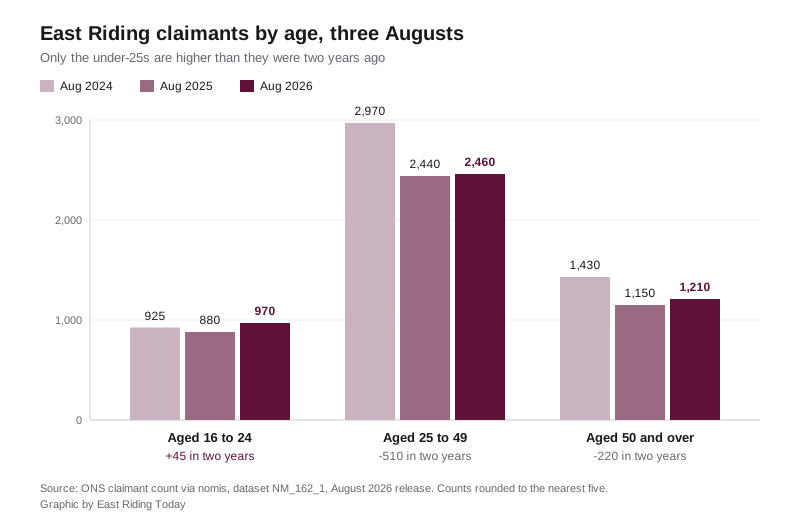
Under-25s were 17.4% of the district’s claimants in August 2024. They are 20.9% now. One claimant in five in the East Riding is under 25, and the share has risen in each of the last two years.
Over the last twelve months the count rose by 175 in total. Of that rise, 90 sits in the 16 to 24 band, 60 in the over-50s and 20 in the 25 to 49 band, which covers more than half the working-age population.
The August rise was a national one, and ours was smaller
The count did go up this month, from a revised 4,595 in July to 4,645 in August, a rise of 50. Before anyone reads that as a local turn, the United Kingdom rose by 38,415 over the same month, from 1,660,035 to 1,698,450. That is 2.3% nationally against 1.1% here.
The district also remains a low-claimant area:
- East Riding of Yorkshire: 2.3% of residents aged 16 to 64
- United Kingdom: 3.9%
Over the year the district rose 3.9% and the UK rose 2.1%, so the East Riding is still closing that gap from below.
How the young claimant rise compares regionally
The East Riding’s under-25 count rose 10.2% in the year to August. Yorkshire and the Humber rose 9.8% and the United Kingdom rose 10.0%. The district sits ninth of the region’s 15 councils, so this is not a local failure; it is a national pattern that has reached us at close to the average rate.
The councils above it are Barnsley (+16.7%), North Lincolnshire (+14.9%), North Yorkshire (+13.3%), York (+13.2%), Wakefield (+12.9%), Sheffield (+12.8%), Leeds (+12.4%) and Doncaster (+10.6%). Hull, which the district wraps around, rose least of all at 4.3%.
Where the young claimants are
Ward figures for this series start in January 2026, so August is the eighth month on record. The 26 wards add to exactly 970, matching the district total. The Office for National Statistics rounds ward counts to the nearest five, so treat small differences between wards as noise.
| Ward | Under-25 claimants, Aug | Change since Jan | All ages, Aug |
|---|---|---|---|
| Bridlington South | 90 | -45 | 495 |
| Bridlington Central and Old Town | 75 | +15 | 260 |
| South East Holderness | 75 | 0 | 285 |
| Goole South | 70 | 0 | 355 |
| Minster and Woodmansey | 65 | -10 | 320 |
| Hessle | 55 | +5 | 245 |
| Driffield and Rural | 40 | 0 | 185 |
| Cottingham South | 35 | -5 | 140 |
| Dale | 35 | +10 | 135 |
| Howdenshire | 35 | 0 | 140 |
| North Holderness | 35 | +10 | 165 |
| South West Holderness | 35 | -5 | 170 |
| St Mary’s | 35 | +10 | 175 |
| Beverley Rural | 30 | +10 | 90 |
| Goole North | 30 | 0 | 145 |
| Pocklington Provincial | 30 | +5 | 190 |
| Bridlington North | 25 | +5 | 150 |
| East Wolds and Coastal | 25 | -5 | 140 |
| Tranby | 25 | -15 | 125 |
| Wolds Weighton | 25 | -5 | 140 |
| Cottingham North | 20 | -5 | 105 |
| Snaith, Airmyn, Rawcliffe and Marshland | 20 | 0 | 105 |
| Howden | 15 | +5 | 85 |
| Mid Holderness | 15 | -10 | 115 |
| South Hunsley | 15 | 0 | 65 |
| Willerby and Kirk Ella | 15 | -5 | 110 |
Three things stand out in that table.
- Bridlington South has fallen furthest and is still the highest. It has 45 fewer young claimants than in January, the largest drop in the district, and it still has the most.
- Bridlington Central and Old Town has gone the other way. It is up 15 since January, the largest rise anywhere, and 75 of its 260 claimants are under 25. That is 29%, the highest young share of any ward with more than 100 claimants.
- Beverley’s two wards moved in opposite directions. Minster and Woodmansey is down 10; St Mary’s is up 10.
Across the district the under-25 count is actually down 35 since January, from 1,005 to 970. The January figure was the highest for any month since the series began, so the fall is from a peak, not a recovery to where things were.
What it means for you
The claimant count is not the unemployment rate. It counts people on Universal Credit who are required to look for work, plus the remaining Jobseeker’s Allowance claimants. Someone working part time on low pay can be in it. Someone out of work but not claiming is not. It is published monthly, about five weeks after the count date, which makes it the fastest local labour market figure there is.
If you are 16 to 24 and out of work in the East Riding:
- The DWP’s Youth Guarantee Journey replaced the Youth Offer in June 2026. Your work coach is the route into it, and the gov.uk guidance on help to find work for claimants aged 16 to 24 sets out what it covers, including referral to a Youth Hub or a youth employability coach.
- Find your nearest office with the DWP jobcentre finder.
- National Careers Service advice is free, by phone or webchat, and you do not need to be claiming to use it.
For everyone else, the practical reading is that competition for entry-level work in Bridlington and Goole is tighter than the district average suggests, and that the district average is doing a lot of hiding. Our East Riding house prices page shows the same split from the other direction, and the council tax bands page covers what a household in each band pays.
Sources: ONS claimant count via nomis, dataset NM_162_1, August 2026 release.
- East Riding monthly series, all ages and by age band, August 2024 to August 2026
- East Riding and United Kingdom, count and rate, last 14 months
- All 15 Yorkshire and the Humber councils, aged 16 to 24, three Augusts
- East Riding wards, aged 16 to 24, January and August 2026
- East Riding wards, all ages, August 2026
Have your say